In the age of algorithmic trading, social media-driven sentiment, and central bank fixation, it’s easy to forget that some of the most powerful financial signals are not in the headlines — they’re buried in operational data that quietly pulses through the arteries of the global economy.
In this report, we decode three of the most effective “under-the-radar” indicators:
- Baltic Dry Index (BDI) – the real-world cost of moving goods
- Copper prices – the industrial “heartbeat” of the economy
- Reverse Repo operations – the hidden fear gauge of liquidity
These are not indicators for short-term price prediction. They are macro mood diagnostics – revealing shifts in the collective vibration of markets. Here’s how to interpret them, and what to do with that knowledge.
Baltic Dry Index (BDI) – Shipping Cost, Real Demand
What is it?
The Baltic Dry Index measures the average cost of transporting dry bulk commodities like iron ore, coal, and grains — the stuff that builds cities and feeds nations. When trade demand rises, shipping prices go up. When it slows, the BDI drops.
It is entirely supply-and-demand driven. There’s no speculative layer.
Current Data (May 2025)
- Latest BDI value: 1,347 points
- Change YTD: +34.10% from January’s 1,004
- Peak: April 2025 at 1,375
- Slight dip in May: Down to 1,347
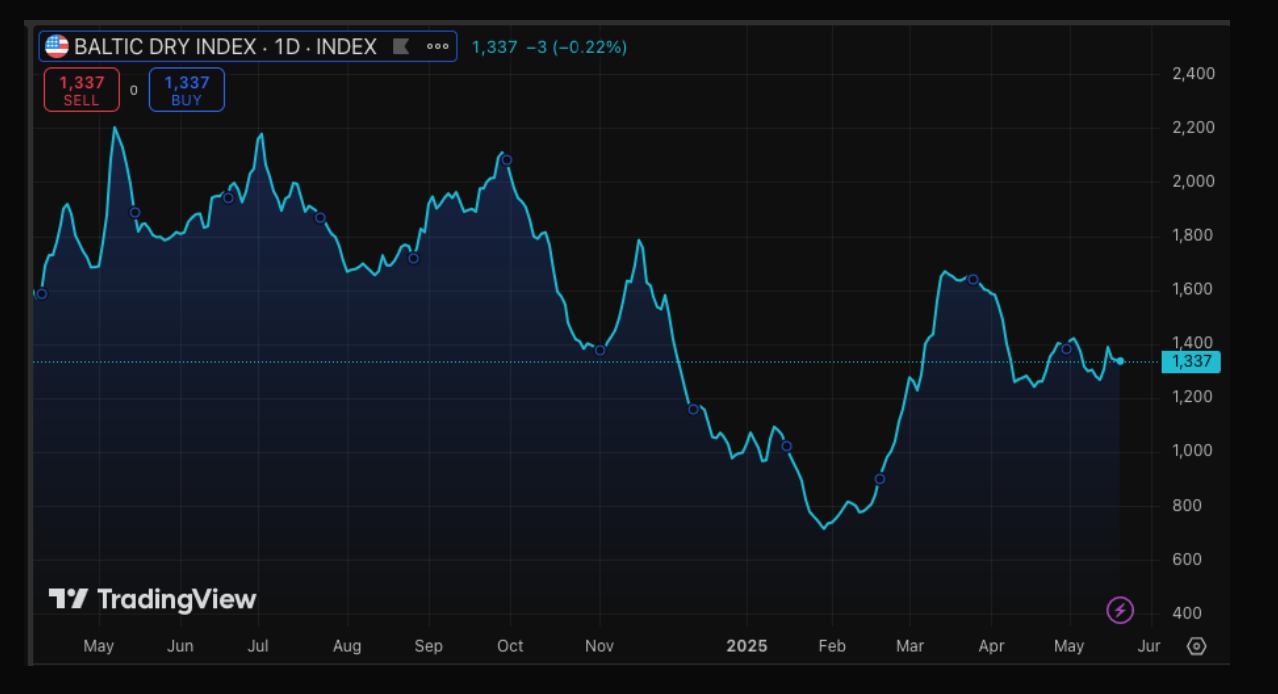
The early 2025 rise showed growing global demand for raw materials — a bullish sign for industrial recovery post-2024 slowdown.
The dip in May is modest, but could signal stabilisation or short-term cooling, especially if it continues for two consecutive months.
Context matters: BDI over 2,000 would indicate overheating; under 1,000 would suggest contraction.
What You Should Consider
- Bullish confirmation: Combine this with strong earnings in commodity-exporting countries (e.g. Brazil, Australia).
- Caution if flattening: Watch if BDI flattens in June — could indicate deceleration.
- Tactical play: Consider long positions in global shipping ETFs or infrastructure funds when BDI is rising.
Copper Prices
What is it?
Copper is omnipresent in industrialised systems — used in power grids, electronics, EVs, and housing. Traders call it “Doctor Copper” because it has a PhD in economics: it senses growth cycles before other indicators.
Current Data (May 2025)
- Latest COMEX price: $4.6380/lb
- Start of year price: $3.91/lb
- YTD Performance: +18.5%
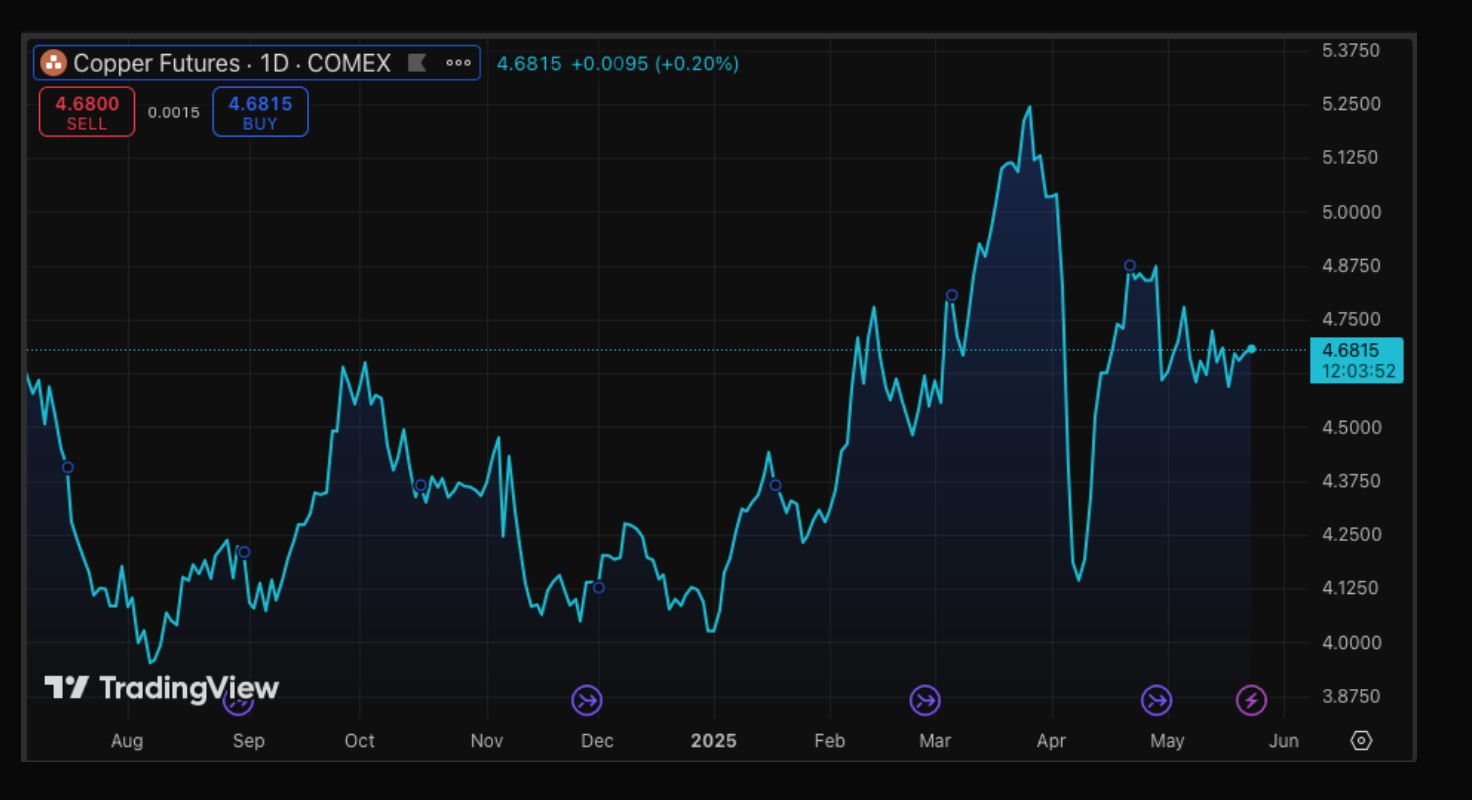
Steady rise in copper prices suggests strong demand — a sign that production, manufacturing, and infrastructure investment are expanding.
If copper prices spike too quickly, it may indicate overheating or speculative pressure.
A sharp drop could indicate fear, especially if paired with weak industrial production data.
What You Should Consider
- Confirming factor: Strong copper → look for buy signals in mining stocks (e.g., FCX, RIO).
- Macro pair: Combine copper prices with China PMI data for global cycle insight.
- Portfolio angle: Consider rotating into industrial ETFs or base metal baskets when copper shows upward momentum.
Reverse Repo Market
What is it?
Reverse repurchase agreements (reverse repos) allow institutions to deposit cash with the Federal Reserve overnight, receiving safe securities in return. Think of it as the financial system’s “panic room”.
Current Data (May 2025)
- Usage trend: Over $1.5 trillion daily
- Compared to 2023: Still elevated
- Fed rate environment: Holding above 4.5%
High reverse repo usage = institutional caution.
Indicates that liquidity is being hoarded rather than deployed.
Can also suggest yield-seeking behaviour in a high-rate environment.
What You Should Consider
- If reverse repo stays high while other macro data improves, it suggests market mistrust — possibly bullish for gold, bonds, or defensive sectors.
- If it declines significantly, capital may flow into risk assets — bullish for equities.
- A sudden spike in usage = red flag, especially if paired with credit spread widening.
Summary Table
| Indicator | Signal Type | What It Suggests | What To Do |
|---|---|---|---|
| Baltic Dry Index | Trade demand | ↑ = industrial growth | Long shipping/logistics/infrastructure |
| Copper Price | Manufacturing | ↑ = economic momentum | Long industrials, miners, EM ETFs |
| Reverse Repo | Risk Aversion | ↑ = liquidity stress/fear | Hedge with gold, short-term treasuries |